If you’re running a business today, you know the digital landscape moves fast. Competitors pop up overnight, customer expectations shift constantly, and the tools you rely on can change in the blink of an eye. How do you make sense of it all? Enter perceptual mapping—your secret weapon for seeing your market in one glance.
Perceptual mapping isn’t just a fancy marketing diagram. It’s a strategic visualization that positions your brand against competitors across dimensions that matter most to your audience. Think of it as a GPS for your business strategy: it tells you where you are, where competitors are, and where the gaps are waiting for you to fill.
What Is Perceptual Mapping?
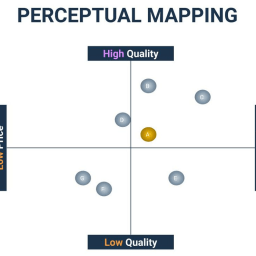
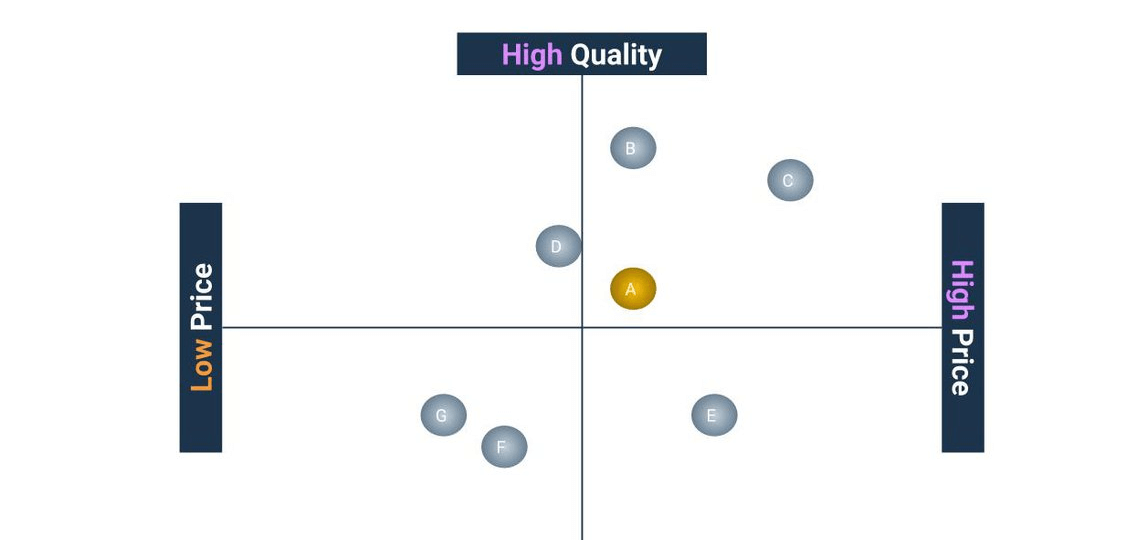
At its core, a perceptual map plots products, services, or brands on a two-dimensional grid based on attributes your customers care about—like price vs. quality, innovation vs. reliability, or simplicity vs. customization.
For example:
- X-axis: Product affordability
- Y-axis: Customer satisfaction
- Brands plotted on this map reveal clusters of competition, market gaps, and opportunities for differentiation.
The visual clarity is powerful: you don’t just guess where you stand—you see it.
Why It Matters Today
- Stay ahead in a hyper-competitive market
With AI tools like SEMRush, Ahrefs, or Moz, you can pull live competitive data and customer sentiment to feed into your map. Perceptual mapping turns abstract analytics into an instant visual strategy. - Spot opportunities for differentiation
Your map highlights crowded areas where everyone is fighting for attention—and more importantly, the empty spaces where your brand can shine. - Inform design and messaging decisions
UX/UI design, marketing copy, and even product packaging can be aligned with gaps in the market. For instance, if your competitors are high-tech but complex, a simple, approachable design could be your winning edge. - Leverage AI for smarter insights
Modern AI tools can analyze customer reviews, social sentiment, and search trends to suggest which axes and attributes will reveal the most actionable insights. This isn’t guesswork—it’s data-driven strategy made visual.
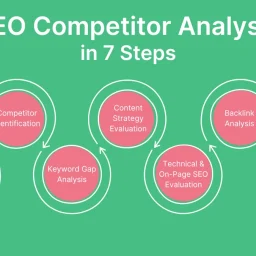
How to Create a Perceptual Map
- Define the dimensions that matter – Price, quality, innovation, convenience, or whatever resonates with your audience.
- Collect competitive data – Use SEO and analytics tools like SEMRush, Ahrefs, or Ubersuggest to understand positioning.
- Plot competitors and your brand – Use tools like Canva, Visme, or Power BI for interactive maps.
- Analyze gaps and clusters – Identify opportunities to differentiate and reposition your brand.
- Take action – Integrate findings into your marketing, UX design, or product development.
A Modern Take
Perceptual mapping isn’t static anymore. With AI automation, cloud analytics, and real-time dashboards, your map can update dynamically—giving you a live snapshot of your market. Combine this with personalization strategies and UX insights, and your perceptual map becomes a strategic compass for growth.
At ONEWEBX, we help businesses visualize their competitive landscape and make data-driven decisions. Whether it’s a small business aiming to carve out its niche or a corporate client optimizing digital strategy, perceptual mapping is a tool you can’t afford to ignore.